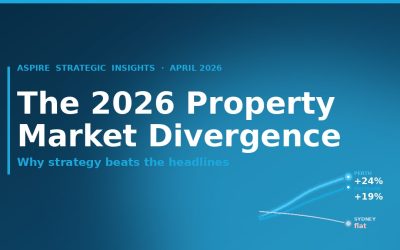
Australia’s housing market just hit the brakes (a little). Here’s why that matters and where the property investment opportunities are.
If you only read one headline from Cotality’s latest Home Value Index market update, it’s this: the market did not fall off a cliff, it simply cooled. After a year like 2025, that’s not only normal, it’s also healthy.
This quarter, I’m watching one thing most closely: where buyer demand is concentrating as affordability bites because that’s usually where the next wave of growth locations emerges.
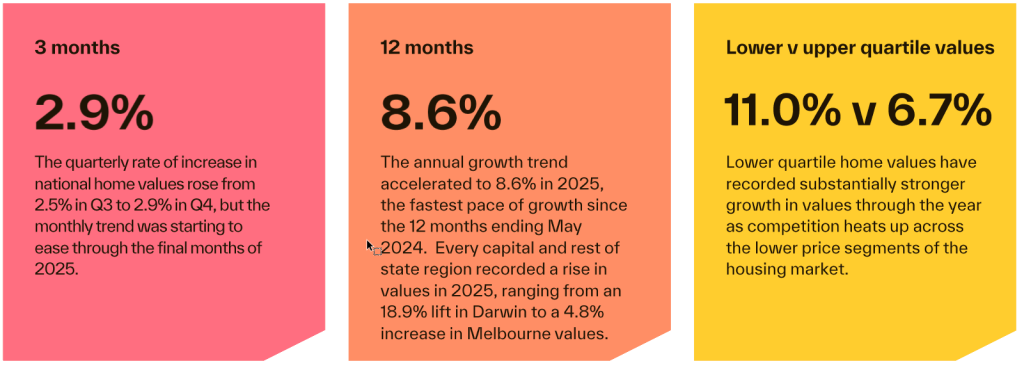
The December result: the slowdown finally showed up in the numbers
Cotality’s national Home Value Index lifted 0.7% in December, the smallest monthly rise in five months. The big talking point was Sydney and Melbourne, both down 0.1% for the month, which was enough to drag on the national headline result.
Understanding property investment trends is crucial for staying ahead in the market.
It is subtle, but it matters because it is the first month-on-month dip in our two largest cities since early last year.
Cotality’s research director Tim Lawless pointed to confidence taking a knock as markets started to price in the possibility that the rate-cutting cycle may be over and that the next move could even be up. In other words, the uncertainty is doing the damage, not the single month of data.
The macro lens: 2025 was strong, even with headwinds
Zoom out and the story gets more interesting.
National dwelling values rose 8.6% over 2025, adding roughly $71,400 to the national median dwelling value. That’s not a flat year. It is one of the stronger calendar-year outcomes we have seen in recent decades, despite affordability and rate pressures in the system.
Source: Cotality Monthly-Housing-Chart-Pack-Jan-2026
Property moves in cycles, but the drivers are rarely just one thing. Rates matter, yet they are only part of the story. Credit settings, cost of living, migration, employment conditions and confidence all influence how buyers behave and where demand goes next.
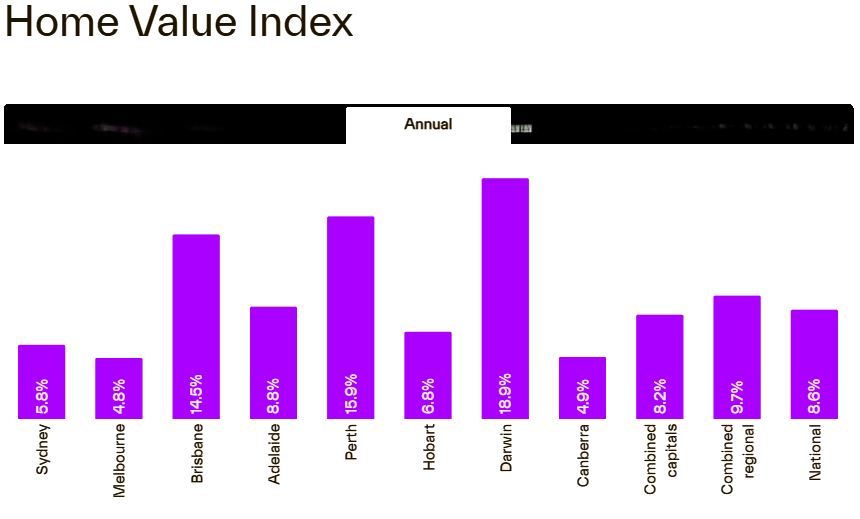
What the annual numbers are really telling us (and it’s not just ‘which city won’)
Here’s what stood out from the annual results:
- Darwin: +18.9%
- Perth: +15.9%
- Brisbane: +14.5%
- Adelaide: +8.8%
- Hobart: +6.8%
- Sydney: +5.8%
- Canberra: +4.9%
- Melbourne: +4.8%
- Combined regionals: +9.7%
- Combined capitals: +8.2%
Source: COTALITY HVI Jan 2026 FINAL
Two takeaways.
First, this is not one national market. It is a patchwork of mini cycles running at different speeds.
Second, the best opportunities rarely sit where the crowd is looking. The crowd chases yesterday’s growth. Investors who build wealth tend to focus on tomorrow’s conditions: supply, affordability, local jobs, infrastructure and the buyer or renter pool.
The hidden story: the more affordable end of the market is doing the heavy lifting
Cotality’s data shows the upper quartile is lagging. In December, upper quartile values rose 0.2%, while lower quartile and middle-of-the-market values were up 1.1%.
This is what affordability pressure looks like in the real world. Buyers and investors do not disappear; they adjust. Demand gets funnelled into the lower-to-middle price points because that’s where serviceability still works.
This also helps explain why I keep coming back to the question of demand concentration. When growth is driven by the affordable end, it’s often a signal that specific locations, dwelling types, or price brackets are about to outperform because they align with what buyers can afford right now.
Some markets are at (or near) peak, others are still finding their feet
This is where a bit of nuance helps.
Cotality research this month shows:
- Sydney is 0.1% below its November 2025 peak
- Melbourne is 0.9% below its March 2022 peak
- Hobart is 5.4% below its March 2022 peak
- Canberra is 2.1% below its May 2022 peak
That doesn’t automatically mean ‘buy these cities. It does mean you can start to separate emotion from the numbers.
Markets below peak are often where pessimism is loudest, listings sit a touch longer, and negotiation improves. For buyers with a long runway, those conditions can be a gift, provided the fundamentals stack up.
Supply is still the quiet support act.
A softer outlook for 2026 does not automatically translate into falling prices, as supply remains tight.
When listings are below normal levels, even slightly weaker demand can still clear the market. That’s a big reason why I’m cautious about sweeping forecasts of major falls. We can absolutely see slower growth or more choppy months. Still, a meaningful drop usually requires either a surge in supply, a sharp rise in forced selling, or a significant shock to borrowing capacity.
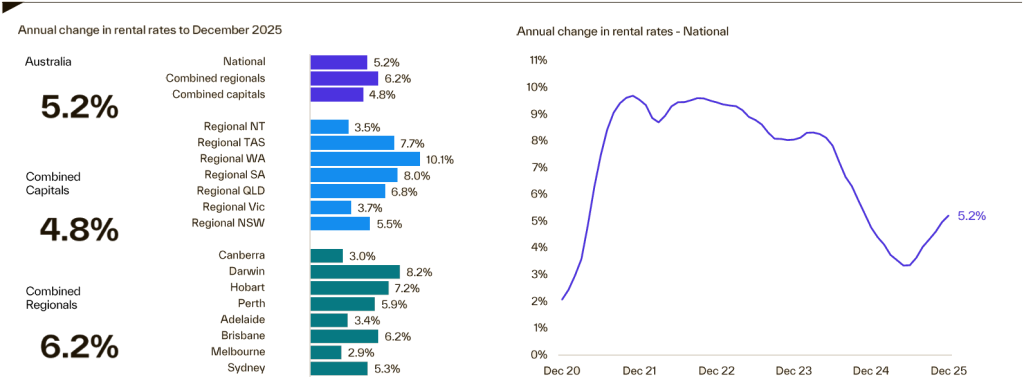
Rents are rising, yields are tightening, and investors are still active
Rents rose over 2025, higher than the prior year, but well below the rental surge we saw earlier in the decade.
Source: Cotality Monthly-Housing-Chart-Pack-Jan-2026
At the same time, prices have risen faster than rents in many markets, compressing yields. Despite that, investor participation is up, which tells us something important.
- Investors are not just chasing yield
- They are positioning for growth and scarcity
- They are backing the same theme the data keeps reinforcing: undersupply is real
So, what happens next in 2026?
Cotality’s base case is for more modest, uneven growth in 2026, with uncertainty around inflation, interest rates and credit policy as key headwinds.
In plain English: sentiment may wobble, but the floor under many markets is the simple fact that we are not building enough housing fast enough.
Practical next steps if you want to act like an investor (not a headline reader)
If you’re using this update to sharpen your plan, here’s a simple way to turn the data into action.
- Define what ‘opportunity’ means for you
Is it price growth, rental resilience, adding a quality asset below replacement cost, or building a portfolio for the next 10 years? - Track the gap between markets, not the national average
Dispersion is the opportunity. Darwin and Perth are not playing the same game as Melbourne right now. - Stay focused on the affordable, liquid segments
Demand is strongest where people can still afford to transact. - Use the ‘below peak’ lens carefully
Below peak can mean value, but only if the area has durable demand drivers and a clear path to constrained supply. - Make your finance strategy part of your investment strategy
In a ‘higher for longer’ environment, borrowing structure and buffers are not admin, they are your risk management.
Closing thoughts
The key message from this update is simple: the market is shifting from broad momentum to more selective conditions, and that’s when the data matters most. Headlines tend to swing between boom and bust, but the real advantage comes from understanding what’s happening beneath the surface. Where demand is concentrated, how affordability is shaping buyer behaviour and which locations have the supply constraints and local drivers to support the next phase of growth.
Property has always moved in cycles. The difference between guessing and investing is having a clear strategy that links the macro backdrop to the micro realities of each market, including price points, dwelling types, rental demand and days on market. If you’re planning a move in 2026, use this update as a prompt to sense-check your assumptions, tighten your buying criteria and make sure your finance settings and buffers are aligned.
If you’d rather not navigate the noise alone, working with professionals who work in the data every day and understand on-the-ground market dynamics can help you avoid expensive mistakes and move with confidence when the right opportunity appears.
Reference Source for more reading: CLICK HERE